Reading Simulation Results Files#
After running a Maha Multics simulation, it is typically necessary to extract
and plot simulation results data. This tutorial explains how to use the
mahautils.multics.SimResults class to accomplish this.
Setup#
To begin, download this sample simulation results file and save it in your working
directory: simulation_results.txt
Additionally, be sure to import MahaUtils and Matplotlib (which we’ll use to generate sample plots):
>>> import mahautils
>>> import matplotlib.pyplot as plt
Reading the File#
Reading the file is easy! Just create a new mahautils.multics.SimResults
and provide the path of the file you downloaded in the constructor:
>>> sim_results = mahautils.multics.SimResults('simulation_results.txt')
Extracting Data#
To extract numerical data, use the mahautils.multics.SimResults.get_data()
method, providing the variable key and desired units. For instance, to extract
the simulation time and the \(x\)- and \(y\)-positions, run the following:
>>> t = sim_results.get_data('t', 's')
>>> position_x = sim_results.get_data('position_x', 'mm')
>>> position_y = sim_results.get_data('position_y', 'mm')
If you aren’t sure what the variable keys should be, you can always use the
mahautils.multics.SimResults.search() method. For instance, to list
all available variable keys, run:
>>> sim_results.search('')
No Group Assigned
  t          : [Required] [Units: s] Simulation Time
  position_x : [Required] [Units: mm] Body position in x
  position_y : [Required] [Units: mm] Body position in y
  speed_x    : [Optional] [Units: m/s]
  speed_y    : [Optional] [Units: m/s]
It’s also possible to search only certain fields:
>>> sim_results.search('position', search_fields='description')
No Group Assigned
  position_x : [Required] [Units: mm] Body position in x
  position_y : [Required] [Units: mm] Body position in y
There are a number of other possible ways to extract data from simulation
results files. For further detail, refer to the
mahautils.multics.SimResults API reference.
Plotting Data#
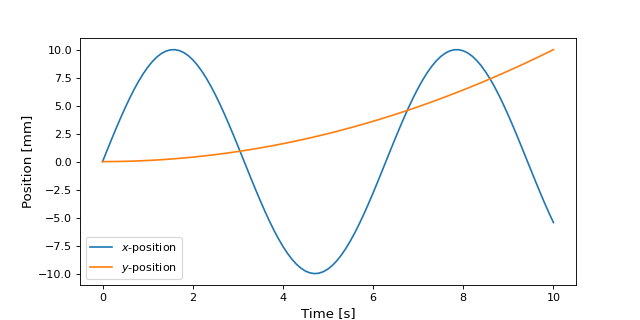
Now that we’ve extracted data from the simulation results file, it’s easy to plot it with any plotting package of choice. As an example, using Matplotlib:
>>> plt.plot(t, position_x, label=r'$x$-position')
>>> plt.plot(t, position_y, label=r'$y$-position')
>>> plt.xlabel('Time [s]')
>>> plt.ylabel('Position [mm]')
>>> plt.legend()
>>> plt.show()
A plot similar to the figure below should be displayed.
Unit Conversions#
When using MahaUtils, one of the main advantages of the package is that it includes built-in unit conversion capabilities.
For instance, suppose we’d wanted to make the previous plot, but using milliseconds for time and inches for the position. In this case, we’d simply need to specify different units when extracting the data:
>>> t_ms = sim_results.get_data('t', 'ms')
>>> position_x_inches = sim_results.get_data('position_x', 'in')
>>> position_y_inches = sim_results.get_data('position_y', 'in')
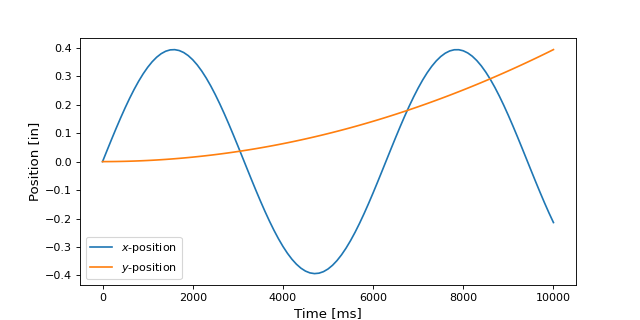
Then, recreate the plot:
>>> plt.plot(t_ms, position_x_inches, label=r'$x$-position')
>>> plt.plot(t_ms, position_y_inches, label=r'$y$-position')
>>> plt.xlabel('Time [ms]')
>>> plt.ylabel('Position [in]')
>>> plt.legend()
>>> plt.show()
And a similar to the figure below should be displayed. Notice that the scaling of the axes has changed to match the new units.