Reading Fluid Property Files
This page will explain how to use MahaUtils to read and plot fluid property files. This can be useful when defining customized fluid properties to ensure that the files are formatted correctly.
Setup
To begin, download this sample simulation results file and save it in your working
directory: fluid_properties.txt
This file contains the fluid properties summarized in the dropdown below, defined for two temperature values and three pressure values. Note that the properties are not realistic and not reflective of a real fluid, but instead are meant to be simple and make it easy to see where in the tables particular numbers are coming from.
Click to see fluid property data
T = 273 K
Fluid Property |
Pressure |
||
|---|---|---|---|
100 Pa |
150 Pa |
200 Pa |
|
Density (\(kg/m^3\)) |
0.1 |
0.2 |
0.3 |
Bulk modulus (\(Pa\)) |
1.1 |
1.2 |
1.3 |
Kinematic viscosity (\(m^2/s\)) |
2.1 |
2.2 |
2.3 |
Specific heat capacity (\(J/kg/K\)) |
3.1 |
3.2 |
3.3 |
Thermal conductivity (\(W/m/K\)) |
4.1 |
4.2 |
4.3 |
Volumetric expansion coefficient (\(K^{-1}\)) |
5.1 |
5.2 |
5.3 |
Specific enthalpy (\(J/kg\)) |
6.1 |
6.2 |
6.3 |
T = 303 K
Fluid Property |
Pressure |
||
|---|---|---|---|
100 Pa |
150 Pa |
200 Pa |
|
Density (\(kg/m^3\)) |
10.1 |
10.2 |
10.3 |
Bulk modulus (\(Pa\)) |
11.1 |
11.2 |
11.3 |
Kinematic viscosity (\(m^2/s\)) |
12.1 |
12.2 |
12.3 |
Specific heat capacity (\(J/kg/K\)) |
13.1 |
13.2 |
13.3 |
Thermal conductivity (\(W/m/K\)) |
14.1 |
14.2 |
14.3 |
Volumetric expansion coefficient (\(K^{-1}\)) |
15.1 |
15.2 |
15.3 |
Specific enthalpy (\(J/kg\)) |
16.1 |
16.2 |
16.3 |
Additionally, be sure to import MahaUtils and Matplotlib (which we’ll use to generate sample plots):
>>> import mahautils
>>> import matplotlib.pyplot as plt
Reading the File
Reading the file is easy! Just create a new mahautils.multics.FluidPropertyFile
instance and provide the path of the file you downloaded in the constructor:
>>> fluid_properties_file = mahautils.multics.FluidPropertyFile('fluid_properties.txt')
Extracting Metadata
First, let’s see how to view file “metadata.” For instance, we can view the number of temperature and pressure values for which fluid properties are defined:
>>> print(fluid_properties_file.num_temperature)
2
>>> print(fluid_properties_file.num_pressure)
3
We can also view the lists of pressure and temperature values for which fluid properties are defined, specifying our desired units:
>>> temperatures = fluid_properties_file.get_temperature_values('K')
>>> print(temperatures)
[273. 303.]
>>> pressures = fluid_properties_file.get_pressure_values('Pa_a')
>>> print(pressures)
[100. 150. 200.]
Interpolating Fluid Properties
Fluid properties can be obtained by interpolating from the fluid property file with
the mahautils.multics.FluidPropertyFile.interpolate() method.
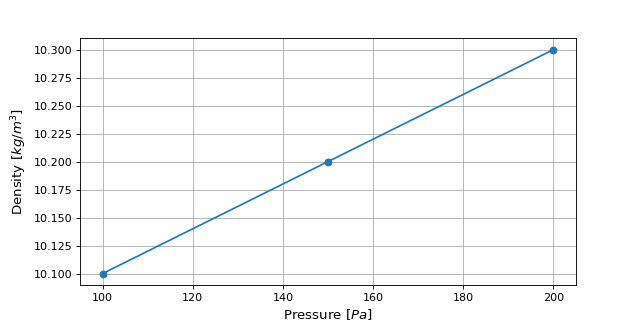
For instance, let’s extract the density for all defined pressures at \(303\ K\):
>>> density = fluid_properties_file.interpolate(
...     fluid_property = 'density',    output_units='kg/m^3',
...     pressures      = pressures,    pressure_units = 'Pa_a',
...     temperatures   = 303,          temperature_units = 'K',
...     interpolator_type = 'interpn'
... )
>>> print(density)
[10.1 10.2 10.3]
Notice that these density values match the tables in the Setup section.
There are many additional options that can be used when interpolating data, including:
Interpolating different fluid properties (viscosity, bulk modulus, etc.)
Selecting from several interpolation methods (linear, nearest neighbor, RBF, etc.)
Interpolating properties for a single pressure and a single temperature, or for multiple pressures and/or temperatures simultaneously
For more detail on all available options, refer to the
mahautils.multics.FluidPropertyFile.interpolate() API reference documentation.
Plotting Fluid Property Data
To visualize the fluid property data, we can plot it with packages like Matplotlib:
>>> plt.plot(pressures, density, marker='o')
>>> plt.xlabel(r'Pressure [$Pa$]')
>>> plt.ylabel(r'Density [$kg/m^3$]')
>>> plt.grid()
>>> plt.show()
This should generate a plot similar to the figure below: